Technical Analysis >> Commodity, Brazil, Euro and Dollar Index
SOY BEAN NCDEX
Soy bean prices formed an expanding triangle near the 61.8% mark. Last time I wrote that a bounce can occur because of the triangle but as shown why not a bottom? Possible Wave Y is over. Either another X wave up retracing the Y or the start of a major impulse. The trend should be up as long as we are above 2650. Breakout of the triangle above 3035 to go to 3286.
COPPER MCX
Copper Closed the week down. Now 365 is the next support. Halting near retracements it is still possible that copper is within a larger corrective structure. The recent rally is not certainly impulsive. So if 365 breaks wee can see it go back to test the 353 low [below 2.62$ to 2.48$].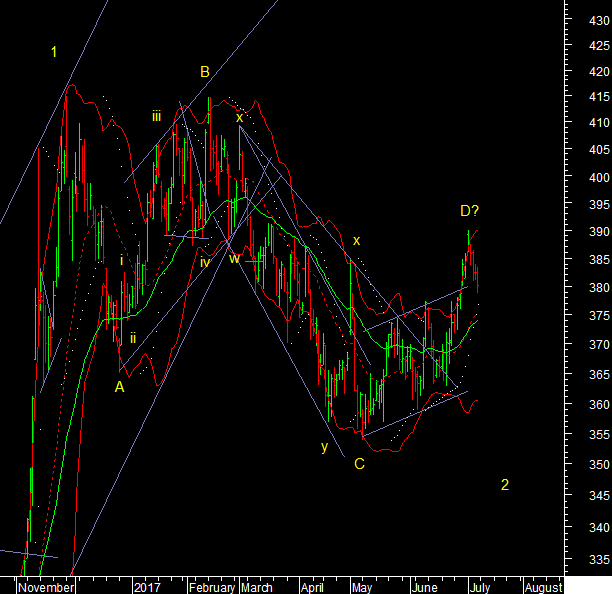
ZINC MCX
Base metals are showing a near term correction after Lead, Aluminium and Zinc look like completing near term 5 wave rallies. The indication therefore is of a positive trend ahead but after a pause correction or retracement. The size of a pullback is hard to say.For Zinc below the 20dma at 173 is the immediate support. 167 is the 61.8% retracement mark.

CRUDE
Crude has fallen in 3 waves so far to 66% retracement. If the low of 43.65 is not broken we can start wave c up to 49.10 or higher.
SILVER MCX
Reccent data from CFTC shows that bulls that were record long at the highs on Silver have given back almost all of their long positions. With sentiment at just 9% bullish we are at the fag end of the decline in gold and silver. The chart shows the falling channel for the price, that I published a while back. At yesterdays low we came close to the line and we may test it one last time in wave z down. The channel is at 35000. The RSI is also entering the oversold sub-30 range.
CORN CBT
Corn – Prices surged with the rest of the Agro prices on the international markets. Corn hit a new high as it starts a larger degree 3rd wave up. Wave 3 up points to 460 just based on 3=1. That is a normal non extended wave over 12 months.
-----------------------------------
BRAZIL

EURO

DOLLAR INDEX

-----------------------------------
Adam Smith Associates offers trade & commodity finance related services & solutions to its domestic and international clients. Visit www.adamsmith.tv for services offered by Adam Smith Associates Pvt. Ltd.
Views expressed in this article are purely of the author – Mr Rohit Srivastava – a leading technical analyst.


