Russel 200 CRB Index and Nasdaq Composite Indices technical analysis
Russel 2000
The Russel 2000 index
is leading the way down and lagged the Dow in its move to new highs recently.
The rollover in prices from record optimism for US stocks marks a point at these highs
that maybe important. In other words an important Medium term top may be in
place for US stocks. There is also a major divergence at the highs on the RSI
as momentum was lost

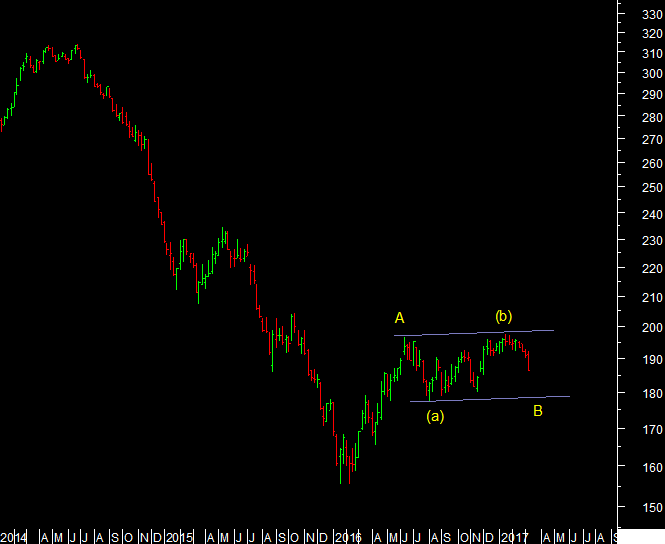
CRB Index
The commodity index
started wave (c) of B down. The failure to breakout into wave C of larger
degree makes this the best case. Commodity prices are reacting accross the
board but this index has a larger component of energy. We have to give it time
for wave (c) down to complete.
Nasdaq Composite
I have discussed how
the arithmetic scale has been better for US indices since 2009 to fit a channel
into the rise. So the Nasdaq composite is not only at the upper end but at the
point where wave 5=1, and where wave 3=1.618 times wave 1. This is quite a
perfect fractal, textbook to say the least rare, and the Sensex had the same
fractal fit for the 1999-2000 bull market. Time to see whether wave 5
terminates at this Fibonacci projection as it logically should.

Adam Smith Associates offers trade & commodity finance related services & solutions to its domestic & international clients. Views expressed in this article are purely of the author - Mr Rohit Srivastava - a leading technical analyst. Visit www.adamsmith.tv for services offered by Adam Smith Associates Pvt Ltd


