Posts

Showing posts from January, 2017

Adam Smith Crude Technical Report

Image
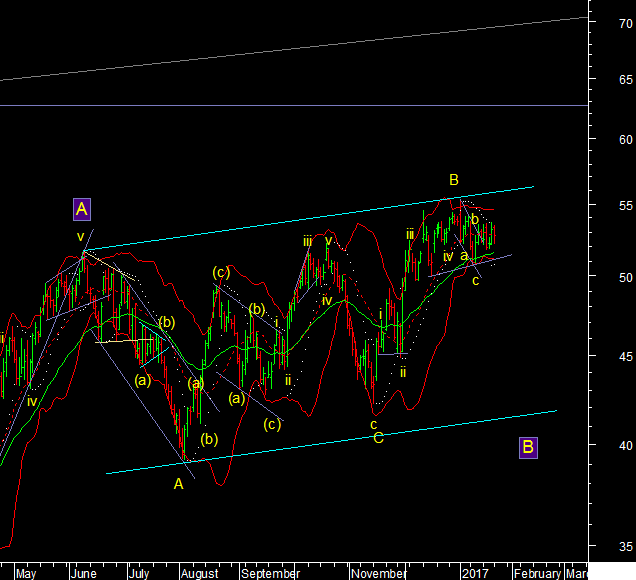
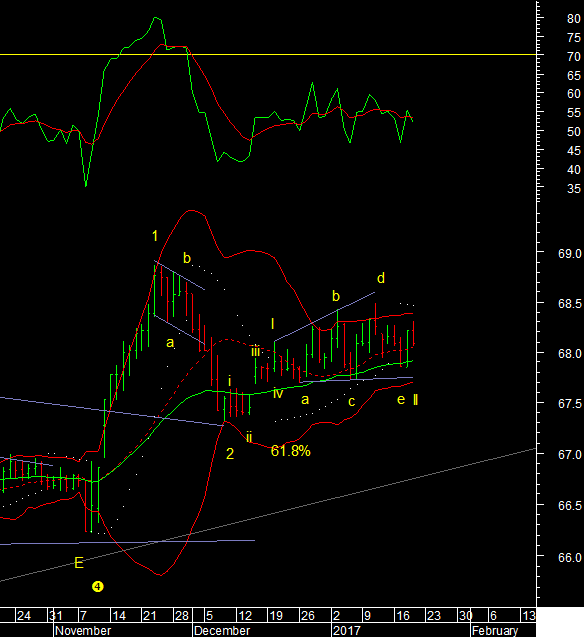
51.50 and 51 are critical support levels for crude. A close below it would imply a change in wave count in favour of wave B forming as a flat. the reason is that after many weeks the daily chart is still not breaking out and momentum is still in sell mode. Positions are getting close to an extreme making the move higher difficult so prices may react. A break of key supports could trigger a move lower towards 45 or 42$ before wave C up can start. On the upside 55.89 can act as a resistance. Adam Smith Associates offers trade & commodity finance related services & solutions to its domestic & international clients. Views expressed in this article are purely of the author - Mr Rohit Srivastava - a leading technical analyst. Visit www.adamsmith.tv for services offered by Adam Smith Associates Pvt Ltd

Adam Smith - Gold Technical Analysis

Image
Gold prices ticked up above the point marked as wave I. So are we still in wave II down? There are times that prices extend without a pause so the question is where to consider that. The only pattern where wave b of II goes higher is called an expanded flat. In that prices do not go above the Fibonacci ratios of 123.6% or 138.2% of wave a. So the levels are 1224 and 1228. A top near these levels can mean that we are still in wave II down and will correct to 1180 before going higher. But once we cross 1228 then we have to consider that wave III up started already without a halt. While that is unusual it is not impossible Adam Smith Associates offers trade & commodity finance related services & solutions to its domestic & international clients. Views expressed in this article are purely of the author - Mr Rohit Srivastava - a leading technical analyst. Visit www.adamsmith.tv for services offered by Adam Smith Associates Pvt Ltd

Adam Smith Associates Pvt Ltd - Technical Analysis on USD v/s INR, Euro and Aluminium

Image
Adam Smith Associates Pvt Ltd - Technical Analysis on USD v/s INR, Euro and Aluminium USDINR - has been in a trading range and support is at the lower end near 67.75. 67.75, is close to 61.8% of the December move and also the lower Bollinger band so it is a good support and should mostly hold. The next move up has not started but when it does we should go beyond the 68.86 high. Wave III of 3 would be the label for the next move. Euro formed a leading diagonal, that means a rise that has the wave structure of a 5-3-5-3-5, and is therefore the first wave of a larger bullish move. The dip yesterday therefore is wave ii. With support at 1.3057 it is possible that wave ii is over. We can also get one more dip to test 1.054 before going higher but it is not a certainty. Once the next move up starts we should see it go test 1.087 Aluminium prices started their next move after making a higher swing bottom at 120.65 This move is likely to carry it to 130 in minor wave iii

Adam Smith Associates Technical Report On US Dollar

Image
USDGBP USDGBP is in a consolidation phase longer term. Marked as a 4th wave, 4th waves are often triangles. Alternatively a falling channel can take the shape of a flat. What this means is that new highs are unlikely. We are in wave C down. If a triangle is forming we should hold the retracements up to 0.80. Below that odds will favour the channel scenario in which it drops to 0.7750. It is aligning with the weak dollar environment USDAUD The AUD bottomed against the dollar a year back. So the USDAUD pair has been falling since. It was bouncing around in a range that is marked as wave B. Wave C down has started and should carry it far lower to the lower end of a falling channel at 1.23 USDCAD USDCAD - broke down from the triangle pattern see in wave C. The Long term pattern is one of a Head and Shoulders top. The pink neckline of the shoulders is the last support at 1.2845. The pattern suggests that this level will break. We have started wave C down fr

Adam Smith - Nikkie Technical Report

Image
The top in the dollar is also a bottom for the Yen and a top for the USDJPY contract that has been the main driver for Japan. The Nikkie index therefore has topped at the end of 3 waves at 78.6% retracement of the previous fall and another move lower may have started in wave C down at larger degree. The lower end of the channel is at 13800. Adam Smith Associates offers trade & commodity finance related services & solutions to its domestic & international clients. Views expressed in this article are purely of the author - Mr Rohit Srivastava - a leading technical analyst. Visit www.adamsmith.tv for services offered by Adam Smith Associates Pvt Ltd

Adam Smith Associates - Is Philippines going through crisis?

Image
Philippines - PSE Composite, fell in 5 waves before the recent bounce. It was mostly a counter trend bounce in what is wave C of a bear market. This market remains a weak spot in Asia. The recent rally in wave 2 stopped at the 50% retracement mark and till we stay below it we may have already have started the next major wave lower. The big Picture below also shows a head and shoulders pattern Long term. Chances are that the next move lower will now break the neckline. For something this massive to happen Philippines must be going through some major crisis in the Asian region. Adam Smith Associates offers trade & commodity finance related services & solutions to its domestic & international clients. Views expressed in this article are purely of the author - Mr Rohit Srivastava - a leading technical analyst. Visit www.adamsmith.tv for services offered by Adam Smith Associates Pvt Ltd

Adam Smith Associates - Watch out dollar index

Image
The dollar index has been forming an expanding triangle for months. The Dollar closed below the 101.10 level of the yellow trendline that marks the upper end of an expanding pattern. In short the failure to breakout amounts to a false breakout and the implications of the failure should be a move back to the lower end of the range in the coming year to near 91 Adam Smith Associates offers trade & commodity finance related services & solutions to its domestic & international clients. Views expressed in this article are purely of the author - Mr Rohit Srivastava - a leading technical analyst. Visit www.adamsmith.tv for services offered by Adam Smith Associates Pvt Ltd

Adam Smith Associates - You can expect near term correction in BSE Metal Index

Image
The BSE Metal index can be marked as 5 waves up so do not be surprised if a near term correction shows up. A 38% to 50% retracement is normal up to 10700 or 10500. However this should be the first impulse wave of a larger trend up for the sector. So will need to watch out for a re-entry point. Adam Smith Associates offers trade & commodity finance related services & solutions to its domestic & international clients. Views expressed in this article is purely of the author - Mr Rohit Srivastava - a leading technical analyst. Visit www.adamsmith.tv for services offered by Adam Smith Associates Pvt Ltd

Adam Smith - Gold & Silver Technical Trends

Image
Gold is making new highs extending last weeks rally. In Elliott wave language an extentions means adding 3 more waves higher before the trend can end. On the other hand Silver is still to make a new high. Gold is showing extentions on the hourly chart so I am imposing the wave count from the spot Comex chart on the Mcx chart below. Hourly charts show wave iv ended and wave v up started. The vth wave is subdividing into a 9 legged rally. 1230$ is the Fibonacci projection for an extended wave, and 1247$ is the 50% retracement mark. In rupee terms it could be closer to 29500-30000. Silver made a high at 16.9820 which has not been surpassed over the last few days. But when done then we are looking at 17.40-17.84 as the next two levels on the way up. 17.84 is where wave iii=i. 17.61 the 40dema is acting as a support.  Adam Smith Associates offers trade & commodity finance related services & solutions to its domestic & international clients. Views express

Adam Smith Associates - Euro formed a doji star

Image
The Euro formed a doji star. A doji star is when the open and close for the week is the same. A doji star represents a loss of momentum or a pause in trend. The following week usually confirms this by a close above or below the high/low of the doji star candle. This week we closed above the high made last week confirming a potential trend reversal from down to up that should test the previous swing high of 1.087. Adam Smith Associates offers trade & commodity finance related services & solutions to its domestic & international clients. Views expressed in this article is purely of the author - Mr Rohit Srivastava - a leading technical analyst. Visit www.adamsmith.tv for services offered by Adam Smith Associates Pvt Ltd

Adam Smith Associates - Dollar Index - Failure To Cross 104 Level Can Results In Long Term Bearish Trend

Image
The Dollar index has been falling for three consecutive weeks. The decline so far is not huge but it was enough to push the weekly momentum back to the sell side. However we have not gone back below the trendline of the expanding pattern seen since 2015. The level is 101. A close below 101 would make the most recent rally a false breakout from this pattern. Most dollar index bullish calls are based on an exponential move from this breakout. However the rally ended at 104 near the 61.8% mark of a long term retracement resistance, of the 2002-2008 bear market in the dollar. That was a very important level and was not surpassed. Failure to cross 104 can result in long term bearish consequences. Adam Smith Associates offers trade & commodity finance related services & solutions to its domestic & international clients. Views expressed in this article is purely of the author - Mr Rohit Srivastava - a leading technical analyst. Visit www.adamsmith.tv for services

Adam Smith Associates - Watch Platinum It May Go Up To 1072$

Image
Platinium Spot prices can often give lead indications about the Precious metals space. The ending pattern at the end last years correction shown in blue on the chart was indicative of a possible bottom soon. Though it did take time and retraced more than I would like, the reversal is complete. We now have an upward breakout into a 3rd wave. Wave 3 would retest the highs in the coming year. 3=1 points to 1260$ as a potential level for the coming year. Near term there is support at 957$, The initial rally was impulsive and if it extends we will go to 1072$, in the coming weeks Adam Smith Associates offers trade & commodity finance related services & solutions to its domestic & international clients. Views expressed in this article is purely of the author - Mr Rohit Srivastava - a leading technical analyst. Visit www.adamsmith.tv for services offered by Adam Smith Associates Pvt Ltd

Adam Smith Associates - Soy Oil Charts Positive Trend

Image
Soy Oil has been in an uptrend for most of the year with brief corrections. the move up will complete 5 waves. So far we are in the third wave and probably wave 5 of 3. The chart shows a good channel and prices were resisted at the upper channel a couple of times. The channel line is now near 760 as the next resistance. Fibonacci projections go to 770 and 804. The recent bottom was near 704 marking one more higher bottom for prices Adam Smith Associates offers trade & commodity finance related services & solutions to its domestic & international clients. Views expressed in this article is purely of the author - Mr Rohit Srivastava - a leading technical analyst. Visit www.adamsmith.tv for services offered by Adam Smith Associates Pvt Ltd

Adam Smith Associates - Aluminium prices moving northward

Image
Aluminium prices surpassed the December high to a new 52 week high this week. The 20 week average [red line] held as support, and the weekly momentum in the upper end of the chart went back into buy mode. All the moves last year were corrective and were therefore indicating the move up was corrective. That entire pattern is taken as a triangle that ends in wave E. Only from there do we start a new impulse wave up. Now we are starting a third wave that can go up to 135 in the next wave based on Fibonacci projections Adam Smith Associates offers trade & commodity finance related services & solutions to its domestic & international clients. Views expressed in this article is purely of the author - Mr Rohit Srivastava - a leading technical analyst. Visit www.adamsmith.tv for services offered by Adam Smith Associates Pvt Ltd

Adam Smith Associates - Will Gold Rally Further?

Image
I have been of the view that Gold made a long term bottom in Dec 2015 and the fall this year is a retracement of that first rally. The Weekly Gold MCX chart below shows wave 2 completed in A-B-C and the start of wave 3 Up. Wave 3 has the implications of a move equal to wave 1 at least. 3=1=35450 as the potential level that we can achieve in a third wave rally in the next 6 months. 3rd waves can also extend where 3=1.618*wave 1 = 41000. These would be beyond the all time high of 35075 made in 2013. During the wave 2 correction Volumes were consistent with the trend i.e. declining on the way down and not rising. Volumes should expand on the way up Adam Smith Associates offers trade & commodity finance related services & solutions to its domestic & international clients. Views expressed in this article is purely of the author - Mr Rohit Srivastava - a leading technical analyst. Visit www.adamsmith.tv for services offered by Adam Smith Associates Pvt Ltd

Adam Smith Associates - Nickle's next move should attempt to go above 725

Image
Nickel saw some big moves yesterday. I presumed it had bottomed out last week with the rest of the metals but apparently that was wrong. However daily momentum remains in buy mode and yesterdays bullish candle pattern with a long lower shadow shows buying coming in at lower levels. So adjusting the wave count, wave 2 might have ended at yesterdays low of 661, near the Oct swing lows. The next move should attempt to go above the 725, and once above that Nickel should retest the wave 1 high of 816 made in November Adam Smith Associates offers trade & commodity finance related services & solutions to its domestic & international clients. Views expressed in this article is purely of the author - Mr Rohit Srivastava - a leading technical analyst.

Adam Smith Associates - Soy Meal should move from 310 to 420

Image
Soy Meal Continuous has been consolidating for 3 months in a narrow range after the initial move up. The next move higher may now have started. Yesterdays move broke out of the trend line of the highs and closed above it. Soy prices should move from 310 to 420 near the previous high in the 3rd wave on the CBT exchange. Staying above the 315 and 325 short term supports should be bullish for Soy. Adam Smith Associates offers trade & commodity finance related services & solutions to its domestic & international clients. Views expressed in this article is purely of the author - Mr Rohit Srivastava - a leading technical analyst.

Adam Smith Associates - A move above 52.30 would break out crude

Image
Crude fell over the last week to the lower Bollinger band and has started higher. A move above 53.20 would breakout of the small falling channel and start the next move higher. The move would have the potential of testing the 62-66$ mark. 50.75 and 52.70 are support levels. The 40 day exponential average [40dema] the green line is a support for prices holding which on a closing basis I would expect the start of a new rally to new highs. Adam Smith Associates offers trade & commodity finance related services & solutions to its domestic & international clients. Views expressed in this article is purely of the author - Mr Rohit Srivastava - a leading technical analyst.

Adam Smith Associates - Silver making a bottom has been slow

Image
The process of Silver making a bottom has been slow. A year ago too we saw the same. Even as it makes higher bottoms the hourly chart shows corrective moves that are all part of a possible running pattern. A running pattern is a consolidation that is slightly rising in nature. Today morning we are at the lower end of the running pattern at 16.66$. So this support holding it should provide the spring board to start wave 3 up to 17.25. Below 16.66 we would see a deeper retracement in the metal. Adam Smith Associates Pvt Ltd provide trade & commodity finance to its domestic and international clients. The views expressed in the articles are of the author - Rohit Srivastava a leading Technical Analyst with over 18 years of experience